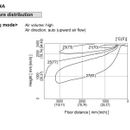
How to Interpret This Minisplit Temp Dist. Diagram
I have attached a picture of a graph that shows a temperature distribution diagram for a Mitsubishi ceiling cassette. I am not sure what useful information to take from this. The best i can tell is that an occupant 3 metres away will feel air that is 6 or 7 degrees (C) higher than at the outlet of the minisplit? Under what conditions and circumstances? Thanks in advance for your input.
GBA Detail Library
A collection of one thousand construction details organized by climate and house part



Replies