Heat Loss Model vs Reality
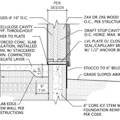
I thought I’d provide some crude “data” on the performance of my superinsulated house compared to the heat loss model I built before construction. The house, in NH (CZ 6) is in its third winter of occupancy. It has a footprint of about 2,000 sqft, on two levels. Being on a hill, about half the lower level perimeter is concrete foundation, the rest being framed, with the entire downhill long side walkout. Framing is double-wall with dense packed cellulose in a 12″ cavity. Attic is vented/unconditioned, with R60 loose cellulose. Sub-slab and foundation wall insulation is R20 XPS. Windows are triple pane. Final blower door test came in at about 0.8 ACH50. Heat is by GSHP, although many evenings we have a small woodstove going on the lower level; it has an outside air kit, so is a mostly closed system.
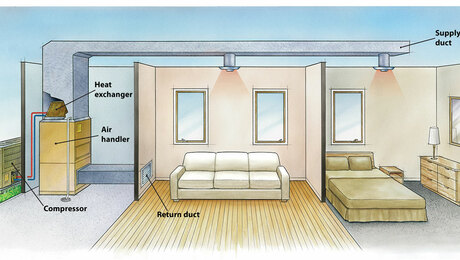
My heat loss model showed a 22, 000 BTU/hr peak heat loss at design outside temperature. Accordingly, a two-stage, two-ton heat pump was installed. The mfg tables for the heat pump show an output of 25,400 BTU/hr in second stage at the operating water temperature and flow and air flow. That leaves a 13% margin for gradual fouling of the heat exchanger and to allow for differences between the model and reality.
I didn’t feel like I was taking an unrealistic risk in basing heat pump size on the model. After all, I felt confident in my numbers, this was new construction where I had control over air sealing and insulation details, and the least certain parts of the numbers were small parts of the total. Moreover, Dan Kolbert, who has built a number of superinsulated houses in Maine, expressed his opinion by email that such houses typically perform better than the model had predicted. I suspect that part of the reason for this is that a house like this rarely is in steady state. The heat loss is so slow that it takes many hours for the wall temperature profile to respond to nightly drops in outside temperature. This tends to damp the net effects of temperature minimums.
I don’t have an awful lot of operating data to confirm the model. Since the heat pump was not even ordered until the insulation was in place and the first blower door test confirmed tightness (0.65 ACH50), we used the small woodstove for heat during the 2010-11 winter. I selected that stove also based on the heat loss model. The tag shows a firing range of 11-28 KBTU/hr, bracketing the design heat loss. I ran the stove from mid-afternoon to burnout at perhaps midnight, reloading every couple of hours until around 10pm. That way we kept the entire house in the mid-50s, which the crew finishing the inside work found perfect. Using an average stove output and guessing low to mid 20s for average outside temperature, the numbers lined up in a very crude way, which told me that the model was at least ballpark correct.
After the first two winters of occupancy, using KWH from the electric bills and subtracting the number for the lowest bill (mid-Sept to mid-Oct I think), I reasoned that the difference would be due mainly to the heat pump use, although some of the extra would have been for lighting in the dark months. Multiplying by the marginal cost per KWH, I got a heating cost of $500-600 for the season, in the range of what I had predicted from the model as best as I could from heating degree days. Moreover, I found that even on the coldest nights the heat pump kept the inside at temperature without running flat out or even going to second stage. Mfg numbers show that in first stage the unit puts out about 76% of maximum, or about 19 KBTU/hr, or about 88% of peak loss per the model. I understood what Dan had said about the conservative nature of the model.
Still, I didn’t have any good numbers for peak heat loss vs the model, only averages. After the first year, I installed an hour meter on the heat pump. I really need to read the meter more often. The heat pump just runs as needed and I don’t think a lot about it. I did get enough readings to get some totals for the 2012-13 heating season. From mid-October to mid-April, the unit logged 1662 hours over 4608 hours elapsed time, or 36% of the time. From some heating degree day data I found for the period, I scaled to find what I’d expect operating hours to have been for January, coming up with an average of 52% of the time. But that wasn’t an especially hard winter.
With the bitterly cold weather we’ve had lately, I have made a point of taking the meter reading several times over the last few days, starting around 9am on New Year’s Day. The first day I discount, at only 8 hours of operation, as we had family over and used the woodstove a lot longer (that little stove really does heat the whole house if we want it to). However, over the last two 24-hour periods, with the outside air temperature consistently near and finally bracketing the design minimum (-3 F), I think I finally have some reasonable data. The unit logged 17 and 18 hours of the most recent two 24 hour periods, or about 75% of the time. We used the woodstove for perhaps six hours on each evening. I figure that without the stove operating I likely would have seen 100% operating hours for the last 24 hours, with outside temperature consistently near design minimum. Since the heat pump is doing the job in just first stage, I figure that is a close approximation to actual heat loss.
Having actual heat loss over something roughly approximating steady state (as close as I’m likely to see it) come in at just 12% below the model makes me feel a lot better about the house in general and supports the notion that for a new house built to this level of performance a model really can predict reasonably well how the house will do.
GBA Detail Library
A collection of one thousand construction details organized by climate and house part


Replies
Dick, That is encouraging news. You are no doubt enjoying the current weather more than most of your neighbours.
Dick,
Thanks for sharing your story. This is what I like about GBA readers: they research their options before building, they build good houses, they know how to use meters and make calculations, and they share their data. These are all good things.
It sounds like you built yourself a great house. Congratulations, and thanks for telling us about it.