
I’ve lived in my house nearly four years now and finally got a radon test. Yay! The result is high. Boo! But what does it really mean? I haven’t written about radon here yet, so let’s have a look.
Radon basics
Radon is a noble gas on the far right side of the periodic table of the elements. I’m sure you know them by heart: helium, neon, argon, krypton, xenon, radon, and now, apparently, a new one named oganesson. But it’s not radon’s association with the formerly called “inert” elements that makes it of interest in the field of indoor-air quality. It’s radon’s ability to get into our lungs and cause lung cancer through radioactive decay.
Radon is a radioactive element in the decay chain of uranium-238, which is found in granite and some other types of stone. We have a lot of granite here in the Atlanta area. You may have heard of Stone Monadnock? Most people call it Stone Mountain, and it’s solid granite.

The problem isn’t completely radon, though. The radon does bring the radioactivity into your house when it seeps in from the soil beneath. It floats around in your indoor air, decaying into other radioactive atoms fairly quickly. It’s half-life is 3.8 days.
Radon decays by emitting alpha particles, which are just helium atoms with no electrons. Alpha particles can cause a lot of damage to lung tissue. They cause even more when the radioactive atom emitting them is attached to the lung tissue.
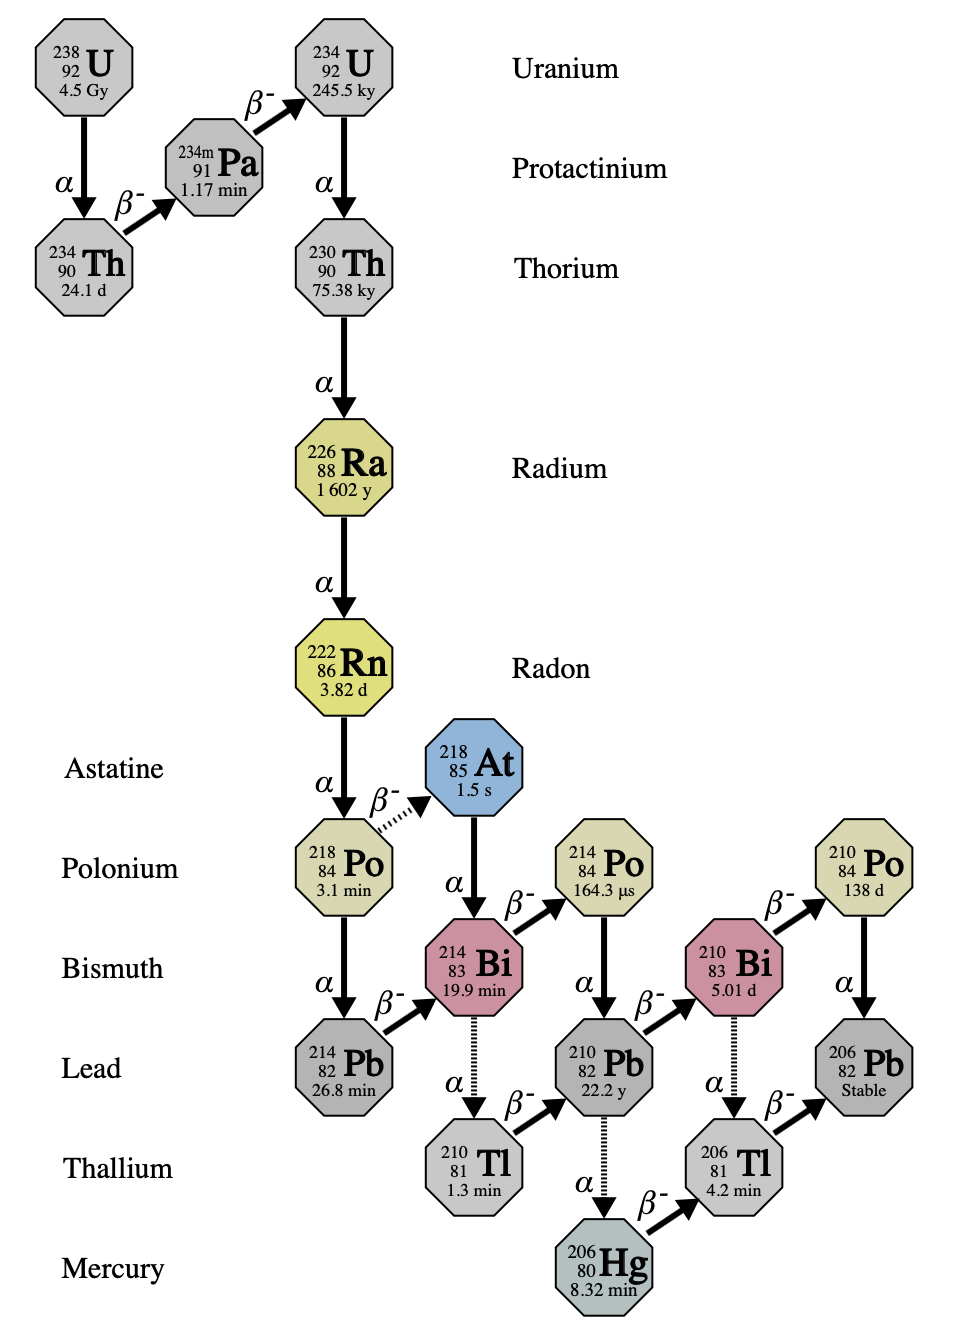
That’s what the progeny (decay products) of radon do. They’re electrically charged, so they stick to the alveoli in the lungs. The decay products polonium-218 and polonium-214 are believed to cause most of the lung cancer from houses with high radon levels.
Why test for radon?
The U.S. EPA has created a map of radon zones in the United States (image below). It shows you the areas where you’re more likely to have high radon levels. Every county and parish is labeled as either Zone 1, 2, or 3. Zone 1 means you have the greatest chance of a high radon level in your home. Zone 3 is the lowest.
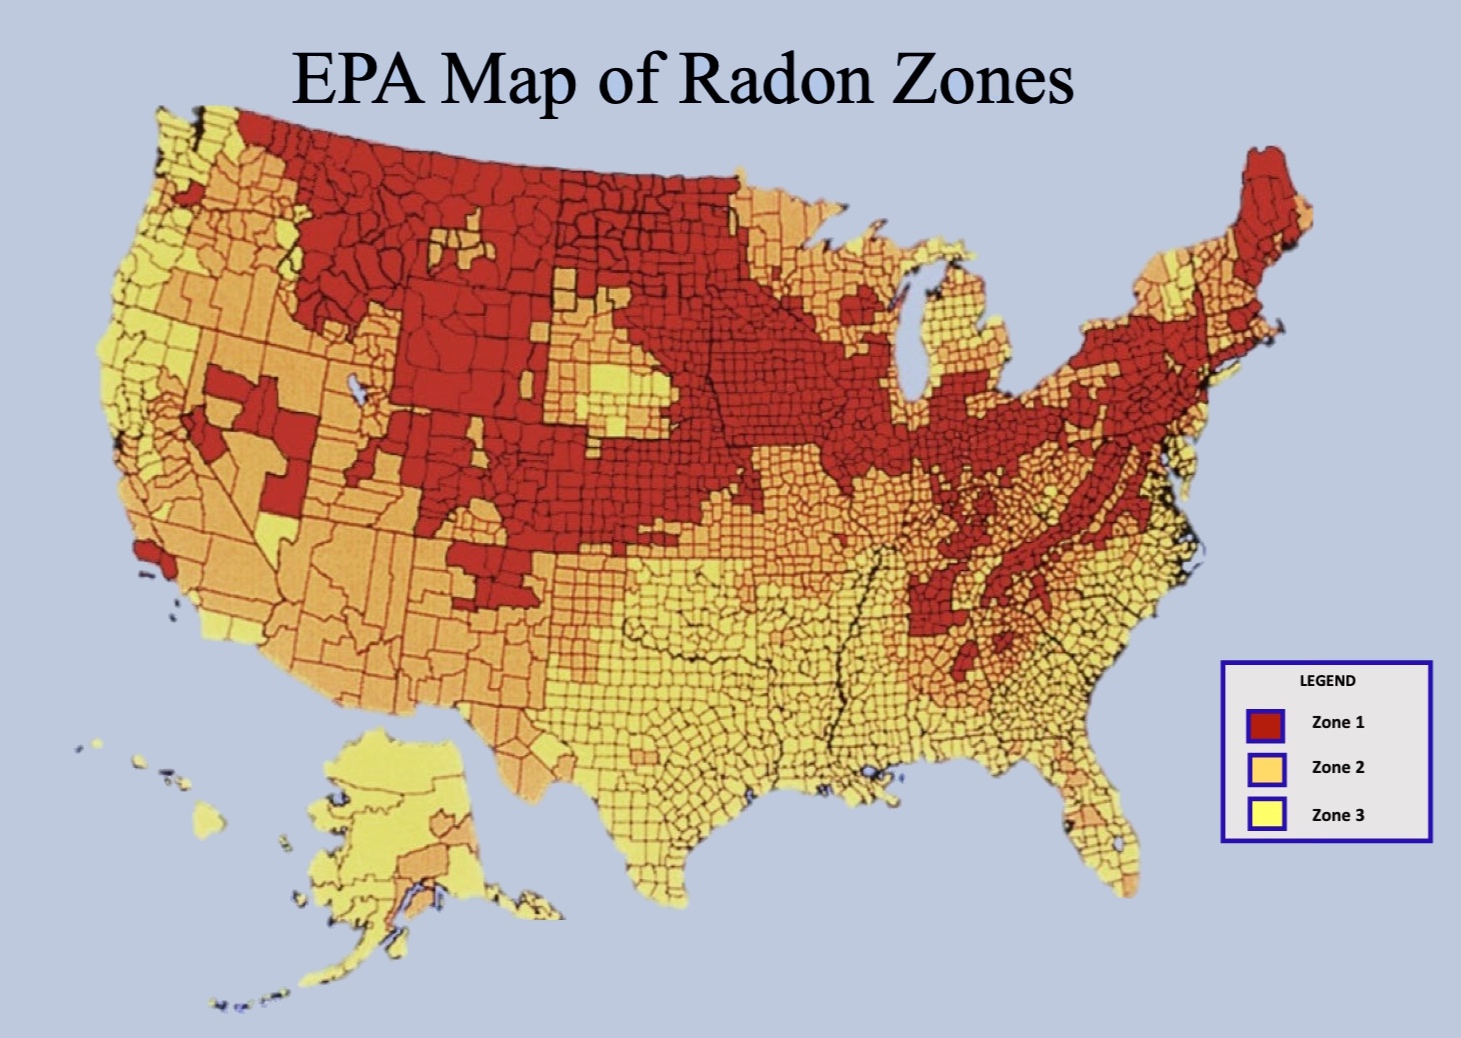
The thing is, that map doesn’t tell you what’s happening with radon in any particular building. You can live on a whole street full of homes with low radon levels, but yours still could be high.
Even in a Zone 3 location, you could have high radon levels. The state of Georgia keeps records on radon test results. Chatham County, Georgia, where Savannah is, shows up as Zone 3 on the EPA map. The highest level recorded in that county is 49.7 picocuries per liter (pCi/L). That’s really high. (See the Georgia radon results map for more.)
You don’t know unless you test. And if you don’t test, you could become one of the 21,000 people who die of lung cancer each year from long-term exposure to high radon levels.
Understanding the result
Let’s discuss units first. I’ve already mentioned picocuries per liter, abbreviated pCi/L. A curie, named for Pierre and Marie Curie, represents 37 billion radioactive decays per second. If that sounds bad, it’s because it is.
And that’s why we’re talking picocuries. A picocurie is one-trillionth (10^-12) of a curie, so that makes it 0.037 disintegrations per second. When you put the “per liter” on it, that makes this unit a concentration. It tells you how much radioactive radon fills the air in your home.
The outdoor concentration of radon, according to the EPA, is about 0.4 picocuries per liter. And the EPA gives guidance on when you should do something about indoor radon levels: You should definitely work on the house to reduce the radon level if it’s above 4 pCi/L, and you should probably mitigate if it’s between 2 and 4 pCi/L.
Here’s a table from the EPA showing the risk to people who have never smoked.
![Radon risk for people who have never smoked [from US EPA]](https://www.energyvanguard.com/wp-content/uploads/2023/04/radon-lung-cancer-risk-never-smoked.png)
As you might expect, smoking increases your risk significantly. For example, at 4 pCI/L, about 4 never-smokers might get lung cancer, but the number rises to 62 for smokers.
In some places, radon levels are measured in bequerels per cubic meter (Bq/m^3) instead of pCi/L. The conversion factor is 1 pCi/L = 37 Bq/m^3. So 4 pCi/L would be 4 × 37 Bq/m^3 = 148 Bq/m^3.
What to do after a high radon test result
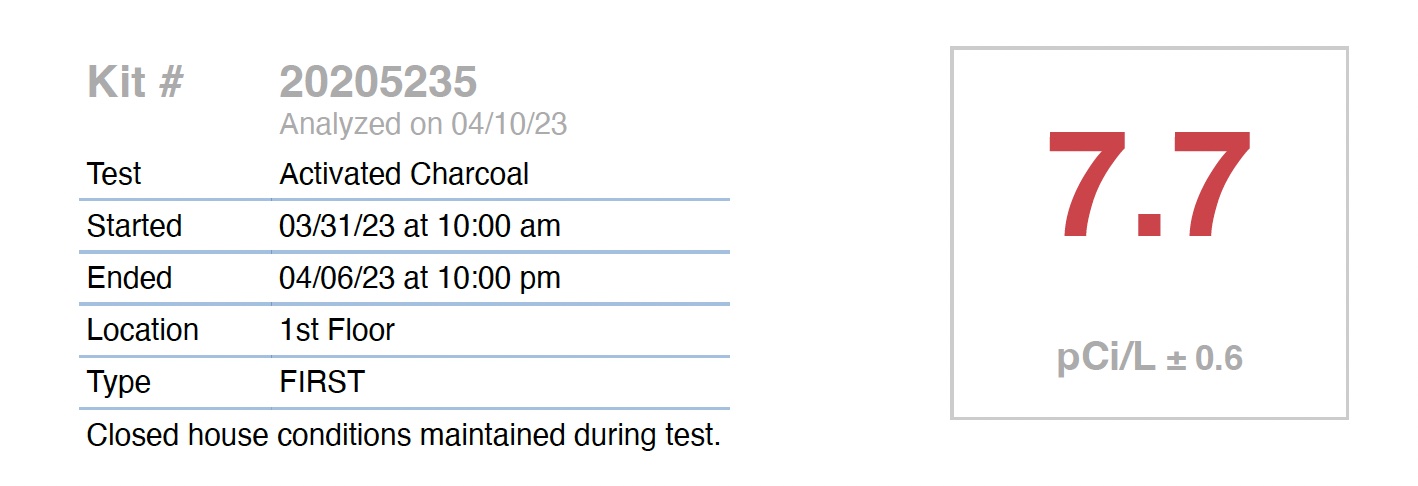
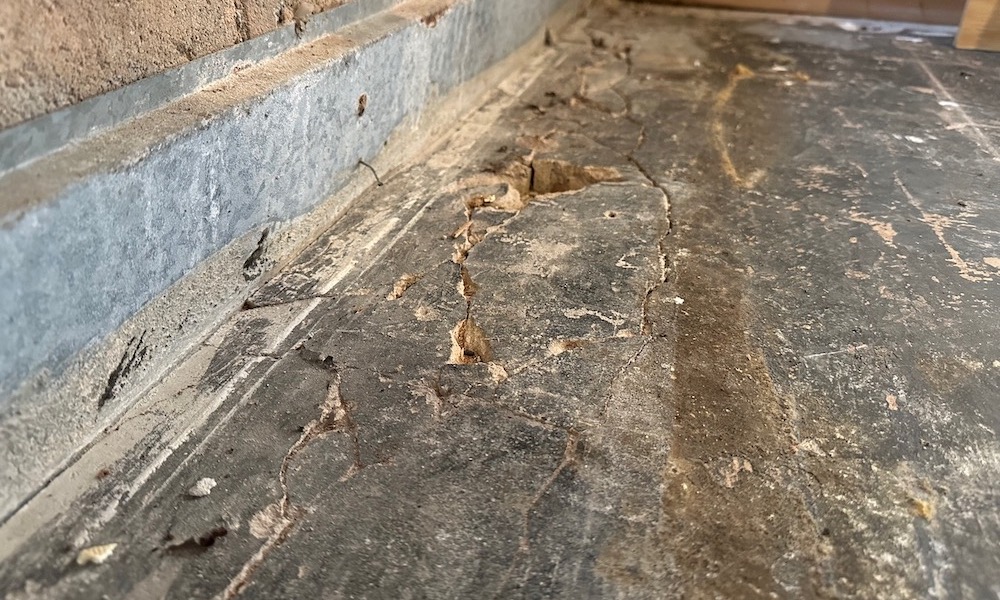
In my case, the first test resulted in a radon level of 7.7 pCi/L. That’s definitely above the 4 pCi/L action level. It doesn’t surprise me that it’s high because I’m in Radon Zone 1. And my basement, which I’m slowly renovating, has plenty of ways for radon to get in. The photo below shows part of my basement slab, and those cracks aren’t isolated to this one spot.
The radon level in my home is far from the highest recorded in DeKalb County. According to that Georgia radon map, the highest recorded level is 95.6 pCi/L, and about 18% of homes tested here have elevated levels.
The other important factor here is that I’ve done only one short-term test. Radon levels fluctuate with all kinds of factors, including the weather. There was a day with 1.8 in. of rain, so that probably bumped it up some. If you do a single short-term test and the result is high, don’t freak out. As I understand it, lung cancer from radon takes exposure over many years. So do a follow-up test.
The test kit I used is meant to be left open in the house for 3 to 7 days. There are also long-term tests that you leave for 3 to 12 months. The long-term number will give you a better idea of your true exposure. I’ve got a couple of those, too, and will be setting one out this week to get it started.
My next steps are to continue working on my basement and getting it sealed up. Those cracks in the slab and other places that allow soil gases into the house are a radon liability.
Radon resources
The first place to go is the U.S. EPA radon page. There’s a ton of information there, including where to get radon test kits, a downloadable copy of the U.S. radon zone map, and a lot more. There’s also a page with links to radon hotlines, programs, and training. Your state may have good resources, including free or subsidized test kits. Here’s the radon page for Georgia. For basic information as well as detailed science, the radon page on Wikipedia is great.
Now, get your house tested. If the radon level is high, test again and start the process of getting it fixed. I’ll come back and write about the important step of radon mitigation later. For now, see the EPA resources above.
Allison A. Bailes III, PhD is a speaker, writer, building science consultant, and the founder of Energy Vanguard in Decatur, Georgia. He has a doctorate in physics and is the author of a popular book on building science. He also writes the Energy Vanguard Blog. You can follow him on Twitter at @EnergyVanguard.
Weekly Newsletter
Get building science and energy efficiency advice, plus special offers, in your inbox.




5 Comments
Allison,
Thanks for this. It's a really useful primer.
Alison,
Thanks for this information. I have an airthings wave air monitor that includes Radon. I have noticed seasonal fluctuations in radon and have wondered if getting an average over a full year is any more beneficial? In the winter radon seems to be higher than in the summer when indoor and outdoor temps are more in sync.
We will likely mitigate because after 6 months of monitoring we have averaged 3.3pci/l. In the winter we hover around 4pci/land this spring about 2pci/l. I guess my results make me question when people get radon test during real estate transactions and whether it is an accurate assessment of radon in the building? If we are concerned of prolonged exposure of a lifetime why are our tests only a few days? -stu
Thanks for this article. Understanding Radon has been on my radar and this is useful and informative.
IMHO, radon risk is overstated..
21,000 deaths, mentioned above, certainly overstates radon risk. According to https://www.epa.gov/radon/health-risk-radon, "Radon is responsible for about 21,000 lung cancer deaths every year. About 2,900 of these deaths occur among people who have never smoked." The mechanism, is the Polonium daughters attach to PM from the cigs and lodge in the lungs waiting to unleash their alpha particle.
The table included says that at the 1.3 pCi/l average indoor level there will be 2 additional lung cancer deaths among every 1000 non-smokers. That would be 500,000 radon-only lung cancers per year for the US population, I guess if we were indoors all the time. But it's supposed to be 3000. Something fishy in the way cancers/thousand were calculated.
There has been considerable research before and since the "action levels" were set to that effect. Some say radon was blamed for cancers in miners and others (used to develop the dose-response correlations) likely caused by other pollutants in mine environments, inc. diesel soot. Others say the dose-response correlations indicated a threshold radon level above zero radon, but were forced through zero, over-predicting risk at even "high" household exposures.
I live with high winter radon, but I do believe in good IAQ. I replaced my gas stove with electric and I run an effective air filter most of the year.
I don't think anyone would argue that the threshold for safe/unsafe is not very precise. But I'd rather be safe than sorry, so pending research that is more accurate--if that's possible, which it probably isn't with today's technology--and the relatively low cost of radon mitigation, I assume that the risk of radon exposure is actually higher than reported.
Log in or create an account to post a comment.
Sign up Log in