That gorgeous photo of a Massachusetts lake above illustrates some interesting psychrometrics. Those little bits of mist are tiny water droplets full of molecules that not long before had been part of the lake. In the air between those misty droplets are gazillions of individual water vapor molecules, also recently evaporated from the lake. We can use that information in our pursuit of understanding wet bulb temperature. This psychrometric quantity is often defined simply as the temperature of evaporation, but let’s dive in to understand it better.
In and out
When you have a body of water—whether it’s a lake, a bowl, or a droplet—it’s doing two things. First, water molecules in the liquid phase evaporate from the surface of the liquid into the surrounding space. Second, water vapor molecules in the space above get captured by the liquid water. At equilibrium, the numbers going in and out of the liquid are equal.
Now, a lot of the time, things are not in equilibrium. In the photo above, for example, more molecules are going from the liquid to vapor state than the reverse. Do you know why?
A difference in temperature
The key to understanding this phenomenon is temperature. But since we’re interested in more than one kind of temperature here, let me be more specific. Let’s talk first about the dry bulb temperature of the air and the temperature of the water (which needs no qualifiers). Then we’ll work our way towards an understanding of wet bulb temperature.
What created the conditions for that photo is something that’s common this time of year. The lake water has been heated up all summer and early fall. Then an autumn cold snap lowers the dry bulb temperature of the air. The lake still has a lot of thermal energy. The air is cold. So the lake evaporates more water molecules into the air than it receives from the air. Nonequilibrium.
In addition, not all of those water molecules evaporating from the lake can stay in the vapor phase in the air. The air becomes saturated. The excess water vapor condenses into that mist of tiny, floating water droplets.
The role of energy
The temperature difference, as you know, represents an energy difference, too. When you put warm water in the fridge, it cools off. That’s just like what’s happening in the lake above. The water cools off, losing thermal energy. It does so by conduction, convection, and radiation, of course. But it also loses heat with every water molecule that evaporates.
Think of all those water molecules in the lake. In a liquid, the molecules aren’t in fixed places. They’re moving around and constantly colliding with other molecules. They also don’t all move with the same velocity. Some move slowly. Some move quickly.
![Distribution of molecular velocities at three different temperatures [Jessie A. Key, BY-NC-SA 4.0 Deed]](https://www.energyvanguard.com/wp-content/uploads/2023/10/Distribution-of-molecular-speeds-of-O2-gas-at-three-temperatures.jpg)
Latent heat of vaporization
Those molecules leaving the surface of the lake don’t do so without paying a fee, though. To go from the liquid to the vapor phase requires energy. We know that it takes heat to turn liquid water into steam by boiling it. In fact, it takes 970 BTU of heat per pound of water (2,256 kJ/kg) to do so.
At lower temperatures, it takes more heat to evaporate water. At 40 °F (5 °C), it takes about 1,070 BTU per pound (2,491 kJ/kg). That thermal energy goes with the departing water molecules, leaving the liquid with less thermal energy and a lower temperature.
Feel the cooling power
Now, let’s change gears a bit. It’s a beautiful sunny day, and you’ve been working hard on a new juggling trick. You’re hot and you want to cool off. So you jump into that lake. After a while, you get out and stand on the shore. A breeze is blowing, and now you’re feeling cooler than you wanted to.
The same thing is happening to you that happened to the lake on that chilly morning. The water on your skin evaporates, taking heat with it. But how cool will you get?
Wet bulb temperature
Now we’ve finally gotten to the thing that this article is about: understanding wet bulb temperature. The cooling effect you feel on your skin is real. You can measure it.
Let’s say you’re like any normal person in this situation, and you want to know what your skin temperature is. Of course, you’ve got your box full of sensors, monitors, and other building science tools, so you strap a thermocouple to the bare, wet skin on your back as you stand at the edge of the water.
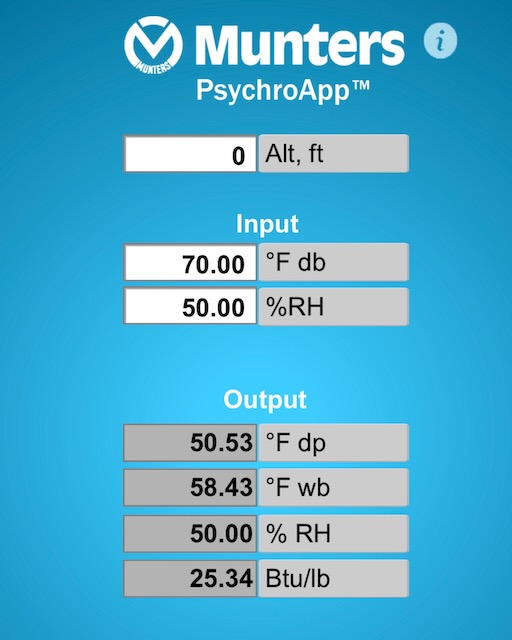
While you’re waiting for that measurement to come to equilibrium, you look at your digital thermo-hygrometer. It reads 70 °F (21 °C) and 50 percent relative humidity. Next, you open the psychrometrics app on your phone and enter those numbers.

As you can see in second line of the output section in the screenshot above, the wet bulb temperature is 58 °F (15 °C). So, depending on how much evaporation you’re getting, the temperature reading of your wet skin could be as low as 58 °F (15 °C). And that’s on a 70 °F (21 °C) day!
Going beyond understanding wet bulb temperature
If you followed all that, you should have a good feel for what wet bulb temperature is now. As I mentioned at the beginning, it’s often called the temperature of evaporation, and now you see why.
At most conditions, that temperature is lower than the dry bulb temperature of the air. That’s where evaporative cooling comes from. And the latent heat of vaporization characterizes the heat exchange that’s happening.
You even know a bit about how you can measure wet bulb temperature. But how would you measure it if you wanted an actual, repeatable result? And how does wet bulb temperature relate to the other psychrometric quantities, especially relative humidity and dew point? You can find out all that and more in the linked articles linked and probably in future articles I haven’t written yet.
________________________________________________________________________
Allison A. Bailes III, PhD is a speaker, writer, building science consultant, and the founder of Energy Vanguard in Decatur, Georgia. He has a doctorate in physics and is the author of a bestselling book on building science. He also writes the Energy Vanguard Blog. For more updates, you can subscribe to the Energy Vanguard newsletter and follow him on LinkedIn. Images courtesy of author.
________________________________________________________________________
† If you want to have fun with this and do some advanced math, you can go down the Maxwell-Boltzmann distribution rabbit hole.
Weekly Newsletter
Get building science and energy efficiency advice, plus special offers, in your inbox.


0 Comments
Log in or create an account to post a comment.
Sign up Log in