Image Credit: USGS
The U.S. Geological Survey has just made it a lot easier to get the details on the country’s flourishing wind-power industry.
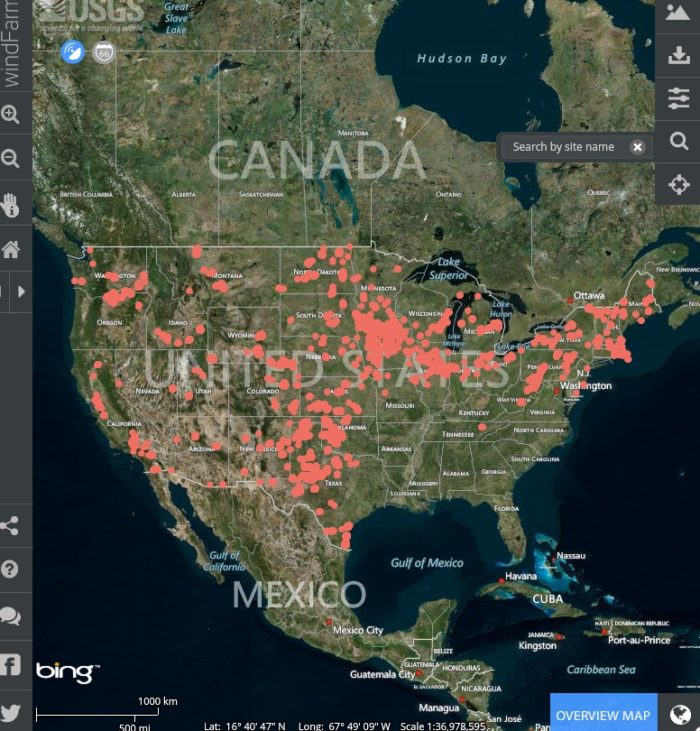
An interactive online map called the WindFarm Mapping Application posted by the USGS shows every wind farm in the country and offers details on each of the 47,000 turbines. By zooming in and pinpointing a specific turbine, visitors can find out how the high tower is, what the rated capacity of the turbine is and when the turbine went online.
Wind turbines currently provide about 3% of the country’s total electricity, the USGS says. That translates to 140 billion kWh of electricity in 2012, or enough to power 12 million homes.
The USGS wanted to learn more about the impact the industry was making on wildlife, such as bird and bats, as well as the environment. The first step was to find out exactly where wind turbines were located, and here the USGS ran into a problem.
“Prior to this study, there was no publicly available national-level data set of wind turbines,” the web site explains. “There were maps that showed turbines locations in a few states, and there were national-level maps that showed wind power facilities, but not individual turbines, or information about those turbines, such as height, blade length, or energy producing capacity.”
WindFarm shows turbine locations as of July 2013. Users can search for data in a number of ways, including zip code and place names. The application is easy to use, with intuitive commands. But if you get stuck or want to learn more about the fine points of data searches, there’s a tutorial at the USGS site.
Weekly Newsletter
Get building science and energy efficiency advice, plus special offers, in your inbox.


0 Comments
Log in or create an account to post a comment.
Sign up Log in