Image Credit: Image #1: Energy Vanguard
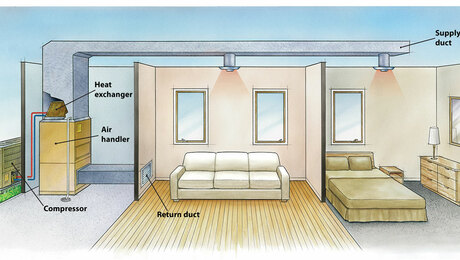
Image Credit: Image #1: Energy Vanguard Using a Reference System in the living room, the Stockton project researchers were able to quantify the penalty for having an HVAC system and ductwork in an unconditioned attic.
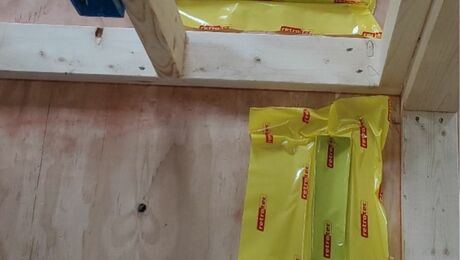
Image Credit: Images #2, #3, and #4: John Proctor, Bruce Wilcox, and Rick Chitwood These data show the difference in air conditioning energy use for the House System (red) versus the Reference System (blue) for one of the four houses (the Fidelia) in the Stockton project. The other homes show similar results, as do the heating data. New ducts in the attic of one of the Stockton project houses (the Mayfair). After blowing new insulation in the attic, most of the ductwork was covered with about R-25 insulation.
At the Forum on Dry Climate Home Performance earlier this year, I got to hear three building science experts talk about a really cool research project they’ve been working on in Stockton, California. Bruce Wilcox, John Proctor, and Rick Chitwood (Wilcox and Proctor are shown in photo at right) filled us in on the Stockton project, which now has two years of data and shows some really impressive results.
The four houses
The research team opened their work by finding four suitable houses to use in the project. They got a relatively new house built in 2005 that’s pretty much at the level of their current energy code. Then they got houses that get progressively worse as you go back in time. The houses were built in 1996, 1953, and 1948, and as you might expect, the three older houses showed much greater savings than the 2005 house. Here’s a table of the basic data:
| House | Year Built | Area |
| Caleb | 2005 | 2,076 s.f. |
| Fidelia | 1990 | 1,690 s.f. |
| Mayfair | 1953 | 1,104 s.f. |
| Grange | 1948 | 852 s.f. |
What they did in the homes was to set them up to collect a year’s worth of data before they made any improvements. All the homes were unoccupied, but the researchers set them up for simulated occupancy. What that means is they automated the controls in each house to run the HVAC and other systems similarly to the way real occupants would.
They also wired up the homes with dataloggers and sensors to collect as much data about the energy use and environmental conditions as they thought might be helpful. They collected indoor temperature, outdoor temperature, wind, incident solar radiation, HVAC power use, relative humidity, when the thermostat was calling for conditioned air, and more.
First, let’s take a look at what I think is the most interesting part of their work.
Quantifying the attic HVAC penalty
One of the best aspects of this research project was how they quantified the penalty for putting the HVAC system in the attic. I wrote a few years ago about a study from the National Renewable Energy Lab (NREL) showing that ducts in the attic result in more energy use and larger air conditioning systems. What they found in this project may surprise you.
In this study, the team installed a second HVAC system, this one in the conditioned space, so they could compare the energy use to the system in the attic. And since it was their project and they could do what they wanted with the homes, they installed what they called the Reference System right in the living room, hanging from the ceiling, as you see in Image #2 below.
It may not be pretty, but the simulated occupants didn’t mind, despite occasionally bumping their simulated heads into the very real air handler. Just kidding! The researchers simulated their heads so well they never banged them into anything. OK, really just kidding! Painful experience has taught researchers not to give simulated occupants any kind of simulated body and definitely no simulated emotions, all because of that one disastrous project where two simulated occupants fought over the thermostat setting and ended up destroying a whole neighborhood. (Really really just kidding. What do you think this is — The Matrix?)
The way they got an accurate comparison was to run the houses in Flip-Flop mode. They’d run the Reference System for two days, then flip to the House System for two days, then flop back to the Reference System for two days… They also kept track of the outdoor conditions so they could adjust for weather.
Recall that for the first year, they monitored the homes before making any improvements. The graph below (Image #3) shows how much better the Reference System performed than the House System in one of the homes (the Fidelia) before improvements. That graph shows the performance in cooling mode. Another graph shows similar results for heating.
They didn’t report Reference vs. House System results for the Caleb, the newest house, but the results for the three older ones were all similar and are summarized below.
| House |
House/Reference Before | House/Reference After |
| Fidelia | 42% | 100% |
| Mayfair | 62% | 95% |
| Grange | 65% | 89% |
What those numbers mean is that before the team made any improvements, the HVAC system in the Fidelia, for example, was using more than twice as much energy as it would have if it had had its HVAC system installed in conditioned space instead of in the attic. That is, since the House System was operating at 42% of the efficiency of the Reference System, it was using 100/42 = 2.4 times the amount of energy. That’s quite a penalty!
The other two houses did better but were still using 1.6 and 1.5 times the energy they would have used with the HVAC in conditioned space.
After the improvements, the numbers are much better. The Fidelia is at 100%, which means the House System was operating at the same efficiency as the Reference System. The way they got it so high was by moving those ducts out of the attic and into a dropped ceiling.
The Mayfair (whose new attic duct system is shown in Image #4 below, before new attic insulation) and the Grange showed great improvement but didn’t get all the way to 100% because the ducts were still in the attic but buried under a lot of attic insulation. They estimated the insulation above the ducts to be R-25. (Warning: Burying ducts under attic insulation is fine in a dry climate like California’s but can lead to condensation and water-damaged ceilings in humid climates.)
What did they do and how much did they save?
The improvements they made in the houses were all similar but varied somewhat based on the needs of the house. The newest house got the least work, and what it got was focused almost entirely on the HVAC system. Here’s a summary of the retrofits on the older three houses:
- New high-performance windows. (The old windows were single-pane windows with metal frames in two of the houses, and double-pane windows with metal frames in the other.)
- Attic insulation.
- Mechanical ventilation systems.
- Two of the houses got wall insulation (Mayfair and Grange).
In addition, all four houses had their air conditioners reduced in size, their ducts improved, and whole-house fans added for night cooling.
And what was the result of all this? How much did they reduce their energy consumption? A lot! Even the newest house got significant savings. Here are the numbers:
| House | Savings |
| Caleb | 35% |
| Fidelia | 71% |
| Mayfair | 74% |
| Grange | 73% |
The savings shown here are for the HVAC systems only, not all the energy use in the houses. Still, those savings numbers are awesome!
Putting it into perspective
The retrofits done on these homes to reduce their energy consumption were standard retrofits that many homes need: air-sealing, duct-sealing, improving duct air flow, adding insulation, and replacing crappy windows. None of the retrofits went through the expensive deep energy retrofit process of having their walls completely stripped and rebuilt. None of them had exterior insulation added to the walls. None of them got spray foam insulation in the attic.
Yet they’re saving boatloads of energy. The three older houses are now using about a quarter of the energy they formerly used for heating and cooling. Wow!
The research team hasn’t put together the costs of the retrofits yet, but they’re certain to be reasonably low. (My guess is in the twelve to thirty thousand dollar range, but that’s just a guess.)
One of the key elements of this work is getting the HVAC system losses as low as possible. If you look at the details of the improvements they made, you’ll see one of the main things they did was to get the ducts to move more air using less energy. Now do you see why I talk about ducts so much here?
This study, which is entering its third year now, is a great example of the opportunities available for saving energy in existing homes. Or, if you look at it the other way, it’s a look at the tremendous amount of energy wasted in so many existing homes.
Allison Bailes of Decatur, Georgia, is a speaker, writer, energy consultant, RESNET-certified trainer, and the author of the Energy Vanguard Blog. You can follow him on Twitter at @EnergyVanguard.
Weekly Newsletter
Get building science and energy efficiency advice, plus special offers, in your inbox.


2 Comments
When cost transparency starts to meet benefit transparency...
"What those numbers mean is that before the team made any improvements, the HVAC system in the Fidelia, for example, was using more than twice as much energy as it would have if it had had its HVAC system installed in conditioned space instead of in the attic. "
Take away 1 - KEEP YOUR HVAC INSIDE! Attic systems require roughly 2x the energy of systems NOT in attics.
Take away 2 - IF YOU ARE SOMEHOW ABLE to find rocket scientist level contractors with nuclear power plant level implementation and qc project management skills - you might make the penalty for attic duct really small.
Take away 3 - If you ALREADY have ducts in the attic, investing some effort towards finding this rare contractor and building a relationship before renovating is likely to be well worth it.
Final conclusion - if energy consumption was public AND readily transparent so total cost is immediately visible, some of the hidden value of these improvements would begin to be obvious. http://bit.ly/apartmentcompair
Until we have the ability to easily see annual consumption per sf, per bedroom, etc, and COMPARE to other homes OF OUR CHOOSING, this type of work will be stuck in early adopter land with a smattering of freeriders.
Costs are often larger than savings
Myself and my wife (and architect and engineer) looked at a deep retrofit. Sure, these 'save energy' but the ROI payback is longer than my lifetime even assuming an absence of maintenance and / or upgrades. This observation is consistent with others who have applied the pencil to deep retrofit projects. Quite disappointing to say the least.
Log in or create an account to post a comment.
Sign up Log in