
Image Credit: Energy Vanguard
More Building Science


We used to build houses without giving much thought to heat flow through the walls, ceilings, and floors. The main thing was to provide some resistance against wind and rain, and then we’d get a fire going to try to make the indoor temperatures bearable.
If you’ve ever lived in an old, uninsulated house, you know that method didn’t work that well so later we started putting insulation into the cavities in building assemblies. Homes with insulated cavities are much more comfortable, but how exactly does heat flow through building assemblies? Turns out there are two ways.
Layers in series
One way heat flows is layer by layer through a building assembly made of multiple materials stacked together. The diagram below shows two layers separating the hot side from the cool side1.
This method of heat flow is pretty simple. All the heat has to flow through each layer. Starting from the hot side (because of the Second Law of Thermodynamics), the heat flows through the pink layer2, then the grey layer. With the caveat about one-dimensional heat flow below, the same amount of heat flows through any section of the assembly.
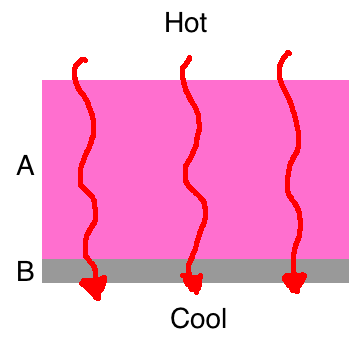
OK, here’s the caveat. It’s not really as simple as I’m making it out to be. It never is really, but we always have to start with the simplified cases and add complexity. In reality, heat flows in three dimensions, and we have to consider what happens at the boundaries. For this analysis, though, we’re considering heat flow in only one dimension. That means a red arrow represents the same amount of heat flow no matter where it enters the assembly.
If all our assemblies were like this, we’d have an easy time with the math for R-values: you just add them all together.
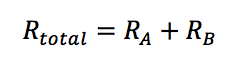
The rule:
Series Heat Flow: Add the R-values
If you’ve put R-5 foamboard on an R-2 concrete wall, for example, the R-value of the combination is 7. Got more layers than that? Just add them in, too.
Parallel pathways
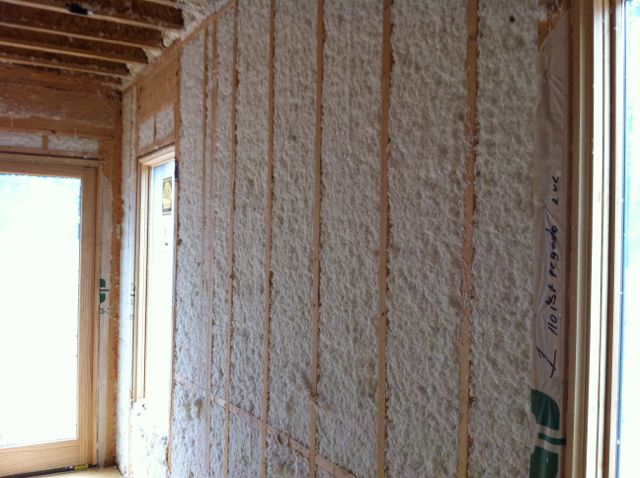
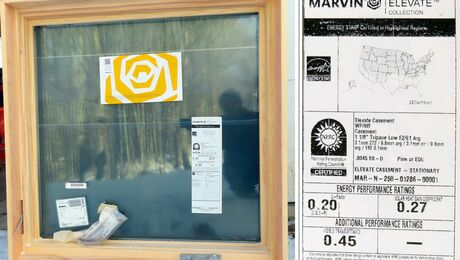
As you can see in the photo at the top of this article, however, the standard wall assembly isn’t just a series of continuous layers. You can see two parallel pathways in the main part of the wall. Windows and doors represent more pathways. A header above a window is another pathway, different from the studs and plates because of the gap between the two pieces of wood, which is filled sometimes either with insulation or partially with wood spacers.
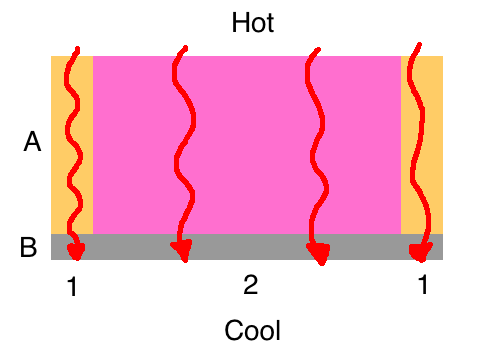
The diagram below shows the heat flow through two different pathways: the framing of a wall (#1) and an insulated cavity (#2). The heat that goes through the insulated cavity (#2) has a harder go of it because insulation is more resitive to heat flow than wood is. The short red arrows indicate that less heat flows through that path.
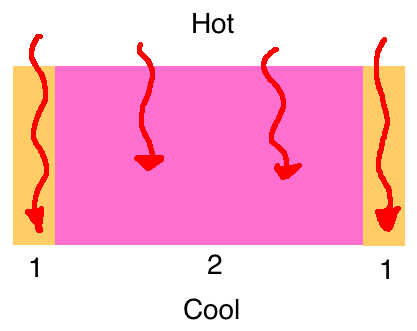
So, the heat has a choice. It can go through pathway #1 or pathway #2. Less of it goes through the pathway with the higher R-value, in this case #2.
But how do you find the R-value of an assembly like this? You can’t just average the two R-values. The first problem with that method is that it doesn’t consider the different areas of the pathways. In a wall with studs spaced every 16″ apart, you’ve got 1.5″ of wood and 13.5″ of insulation in each cavity so there’s a lot more area with insulation than with wood. When you add the wood in the bottom plate, top plates, and other framing members, a standard wall has about 23% wood and 77% cavity.
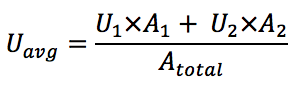
But we can’t just do a weighted average of the R-values either. We actually have to go back to the heat flow equation (Q = U x A x ΔT) to figure out how to do it, and it turns out that we have to do a weighted average of the U-values, not the R-values. Once we find the average U-value, we can convert to R-value to find the average resistance to heat flow, using the equation R = 1/U.
Here’s the rule:
Parallel Heat Flow: Do a weighted average of the U-values
If you’ve got three pathways, you’d add another term to the numerator with U3 x A3. You can add as many terms as you need to include all the parallel pathways. After you’ve got your average U-value, you can then take the reciprocal (1/Uavg) to find the average R-value.
The series and parallel combo
Of course, most building assemblies are a combination of layers in series and parallel pathways. In a wall, for example, you’ve the framing and insulation in one layer, then you’ve got drywall on the inside and sheathing (usually OSB) and cladding on the outside. There’s also air films, drainage planes, and sometimes other stuff to add in there, too.
The diagram at left shows a simple example of a series-and-parallel combination. It could be a ceiling with 2×10 joists, insulation between the joists, and drywall below. (I’ve ignored air films and other stuff here.)
To solve this, you start by identifying the two parallel pathways, 1 and 2. Then you notice that each pathway is a series of layers, A and B. You add the R-values for each layer and then do a weighted average of the resulting total R-values for the two pathways.
The table below lays it out.
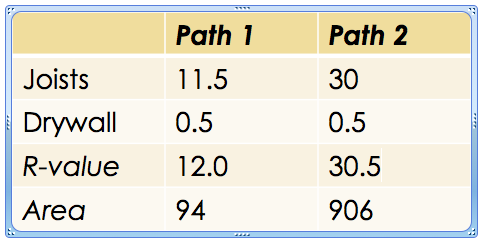
The total R-values are 12.0 for pathway #1 and 30.5 for pathway #2.
The areas are 94 and 906 square feet, so to find the average U-value, you’d set up the equation as follows:
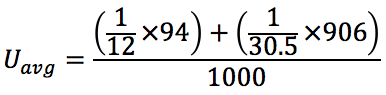
When you do the calculation, you should get 0.038. Taking the reciprocal gives you an average R-value of 26.6.
The video below is from the building science module in our online home energy rater course and explains series and parallel heat flow with another example and a bit more information.
Why windows are rated by U-factor
If you’ve ever wondered why insulation is rated by its R-value and windows are rated by U-factor, it’s the difference between materials and assemblies. Generally speaking, materials are rated by R-value and assemblies are rated by U-factor. The reason should be clear from what we did above.
Assemblies are combinations of layers series and parallel pathways, so to find a number that characterizes their thermal performance, you have to do the calculation for average U-factor. Rather than taking the next step and calculating the average R-value, manufacturers just report U-factor. Not a big deal, especially since we can go between R and U so easily.
The real world is complex
As I pointed out in my caveat above, the real world is more complex than we’re making it out to be here. Also, the examples I used in this article are simpler than the analysis usually done to find U-factors for assemblies since I’ve ignored air films, the complexities of framing, and the other layers that are often present.
In our classes, we provide a spreadsheet that allows students to put in the R-values for each layer in each pathway and see the resultant average U-factor and average R-value. You can do the same thing in the path layer view in the home energy rating software REM/Rate. If you want to get into more accurate modeling of heat flow, you need to use a tool like THERM or WUFI.
Now that you know the fundamentals, you can start calculating average R-values and blow your mind when you see how important a little bit of uninsulated area can be or why it’s important to keep your insulation flat, not lumpy. And if you want to understand thermal bridging, you’ve got to understand layers and pathways.
Allison Bailes of Decatur, Georgia, is a speaker, writer, energy consultant, RESNET-certified trainer, and the author of the Energy Vanguard Blog. Check out his in-depth course, Mastering Building Science at Heatspring Learning Institute, and follow him on Twitter at @EnergyVanguard.
Footnotes
1. Yeah, I know it’s winter as I write this and I even see snow on the ground on this chilly Atlanta morning, but no one gets taken seriously in the world of building science unless they display a hot-climate bias. Either that or I’m hallucinating. Wait, is that really snow!?
2. The colors chosen here don’t represent an endorsement on my part for any particular brand of insulation. Pink happens to show up well in the diagram, but I could just as easily have used blue, yellow, white, green, or black.
Weekly Newsletter
Get building science and energy efficiency advice, plus special offers, in your inbox.


One Comment
Typo?
"16″ apart, you’ve got 1.5″ of wood and 13.5″ of insulation"
perhaps
"16″ apart, you’ve got 1.5″ of wood and 14.5″ of insulation"
Log in or create an account to post a comment.
Sign up Log in